Airplane manufacturers issue takeoff performance charts, which are used by the pilot to determine takeoff and initial climb performance. Depending on the manufacturer, charts may be presented as a table or graphically. It is important to read all notes and remarks on the chart carefully. These notations often contain important instructions concerning proper use of the chart.
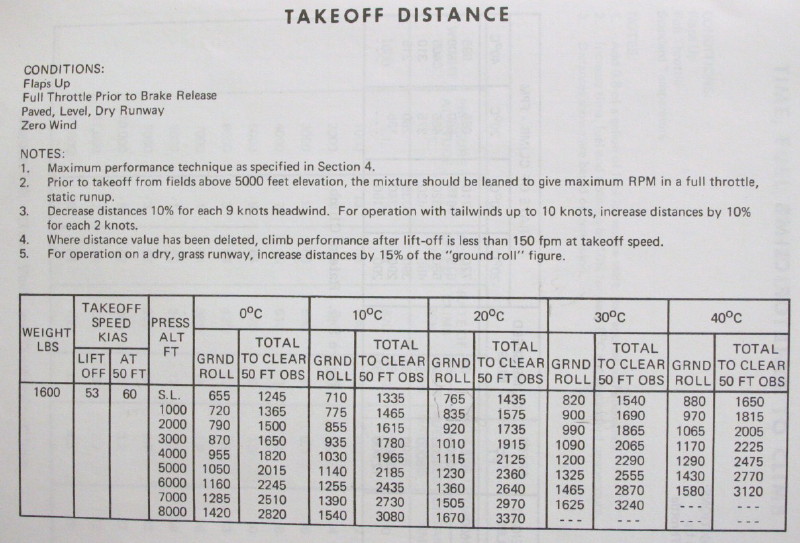
The following is an example takeoff performance chart for a Cessna 150. Reading the chart tells us, for example, at 1,000 feet pressure altitude and 10 degrees Celsius, the takeoff roll will be 775 feet, with 1,465 feet required to clear a 50 foot obstacle. These numbers are qualified by a number of notations, however. They are only valid under the conditions that the flaps are up, full throttle is applied prior to brake release, calm winds exist, and the takeoff be performed on a paved, level, and dry runway. The notes also specify methods for correcting these distances should other conditions exist.
The first note indicates the distances shown reflect the application of the maximum performance technique, which is specified in another portion of the handbook. This tells us that failure of the pilot to apply the described technique perfectly will result in poorer than published takeoff performance.
The second note tells us to utilize an engine leaning technique for takeoffs at airports with a high field elevation, in order to achieve maximum engine power for takeoff at those high elevations.
The third note allows us to correct for an other than zero wind condition. Notice the wording tells us to decrease distances by 10% for each 9 knots of headwind. However, it tells us to increase distances by 10% for each 2 knots of tailwind, but never to exceed 10 knots of tailwind. Takeoff with a tailwind should be avoided, as it has severe negative affects on takeoff performance. Use available wind indicators on taxi out to verify expected wind conditions exist, as winds can change directions in just a few minutes. It is very important to select the correct runway for takeoff. For example, with 13 knots of headwind, 13 divided by 9 times 10% gives us a 14.4% decrease to be applied to the distances shown.
Note four defines the dashed out portions of the table to be those in which the airplane is only capable of a negligible climb of less than 150 FPM.
The fifth note provides instructions on how to correct for takeoff on a dry, grass runway. Since the grass runway will increase ground roll, we are to add 15% of the ground roll figure to the ground roll and the 50 foot clearance distance.
Do not expect these numbers to be exactly accurate. Instead, consider them more of a best case scenario.If this book shows a ground roll of 775 feet, that does not mean it is safe to takeoff with 800 feet of runway remaining. Instead, it is often suggested that 20 or 25% be added to these figures as a more accurate estimation of what the takeoff distance will be. For a book value of 775 feet, we might more realistically expect to see a ground roll of 970 feet.
Still yet, that doesn’t mean we should go out and takeoff with 1000 feet of runway remaining. You’re judgment, flight instructor, and experience will dictate how much runway remaining you decide to use. As with everything, be conservative.
Given how easy it is to find airports with long runways, there’s no reason to try and push to the minimums.
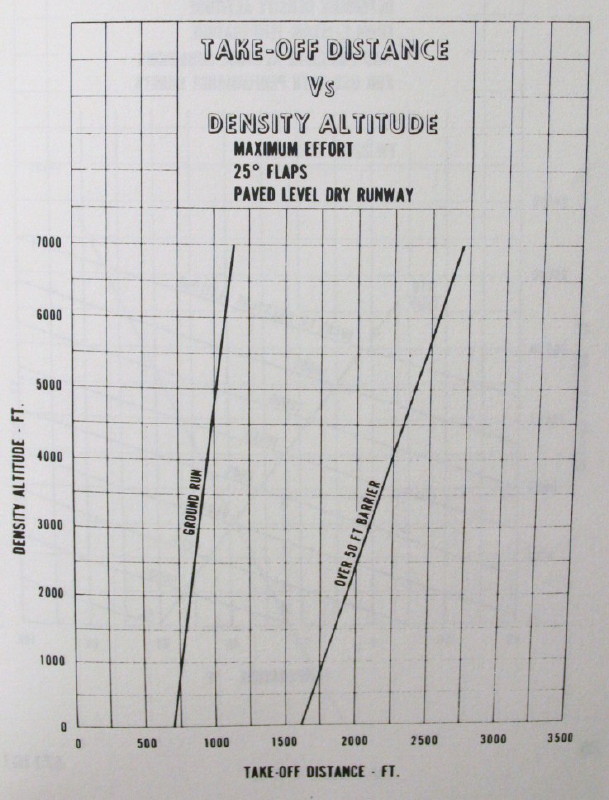
Below is an example of graphic determination of takeoff distances. The conditions applied to this chart are maximum effort, which implies a maximum performance takeoff technique and appropriate leaning technique, if required. Flaps at 25 degrees and takeoff on a paved, level, dry runway are also conditions of the takeoff data provided.
Enter on the left of the graph with density altitude. Density altitude must be calculated from another graph or table. Do not use pressure altitude. If you were to accidentally use pressure altitude instead of density altitude, your performance numbers could be very inaccurate.
Follow the density altitude entered right until it intersects the ground run and 50 foot obstacle lines. Then, simply read the appropriate distance from the scale at the bottom of the graph. For example, at 1,000 feet density altitude, a ground run of about 750-760 feet is given, with a 50 foot obstacle distance of about 1770 feet. The same rules apply – consider this data to be more a best case scenario than the truth.