Significant weather prognostic charts are forecast charts.
They are issued four times a day and become valid at the time printed on the chart. Prognostic charts are best used by the pilot for determining areas to avoid, such as freezing levels and turbulence. Three different prognostic charts are issued, low level, mid level, and high level.
Each chart contains four panels.
Upper vs. Lower Panels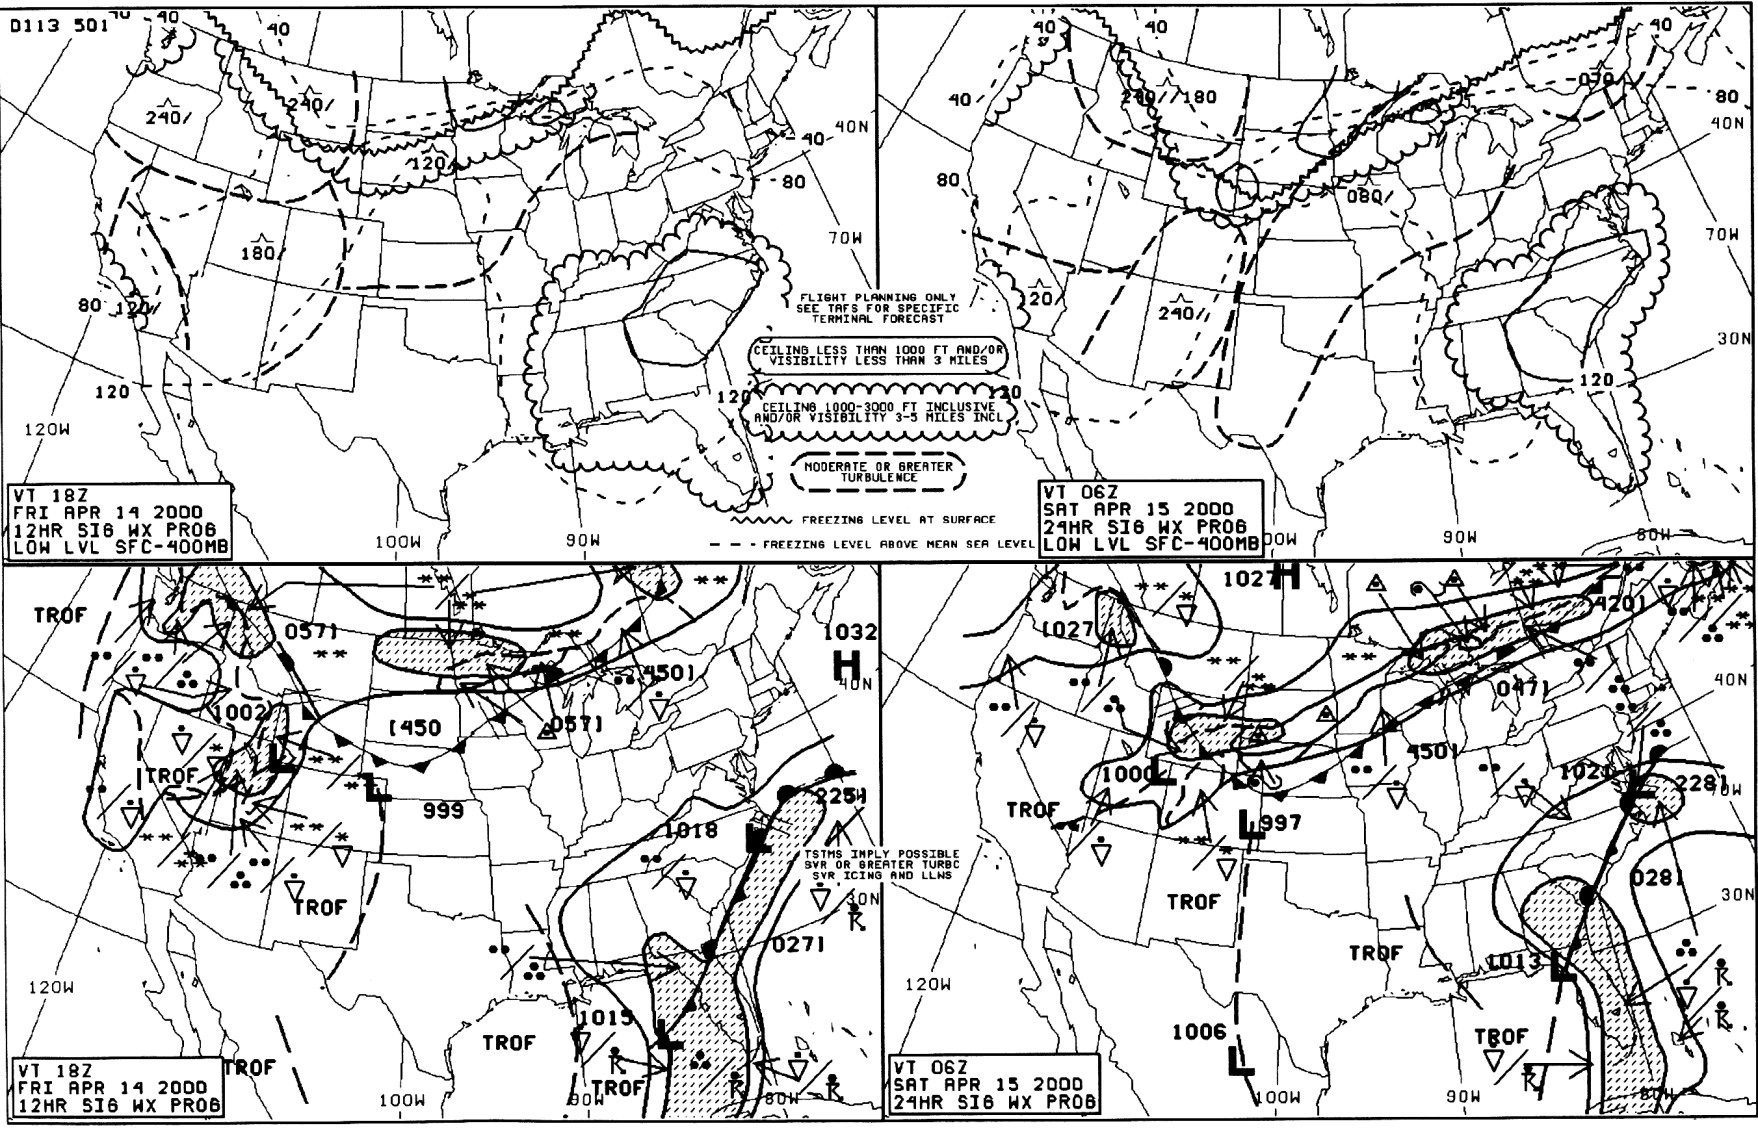
The upper two panels show significant weather, while the lower two panels depict pressure systems, fronts, and areas of precipitation.
Left vs. Right Panels
The left two panels show the 12 hour forecast, and the right two panels show the 24 hour forecast.
Turbulence
Areas of moderate or greater turbulence are shown on the upper two panels by a dashed line. A label shows the height of the turbulence in hundreds of feet. If a line is placed above the turbulence height, it indicates the turbulence exists at and below that height. A line below the height, means the turbulence exists at and above that height.
MVFR and IFR Weather Conditions
Marginal VFR and IFR weather are shown by waved and solid lines, respectively. The long dashed lines across the chart indicate the altitudes at which the air temperature is zero degrees Celsius, the freezing level.
Freezing Level
The saw tooth line depicts locations where the freezing level is at the surface.
Pressure Systems and Movement
Movement of pressure systems is shown on the lower two panels by an arrow pointing toward the direction of movement. The arrow is labeled with the movement speed in knots.
Precipitation Coverage
A shaded area of the lower panels indicates 50% or greater precipitation coverage is expected in these areas. Unique symbols indicate the type of precipitation expected.
Extended Forecast Periods
A 36 and 48 hour significant weather prognostic chart is also available, which provides an extension to this 12 and 24 hour chart. The 36/48 hour chart is issued twice daily.