The weather depiction chart, which is issued every three hours, shows weather conditions at certain weather stations, and also displays the weather conditions in terms of visual, marginal, and instrument. It provides a bigger picture, and is useful for initial flight planning.
Station Plot Model
On the chart, a station model shows the sky condition as the portion of the station symbol which is filled.
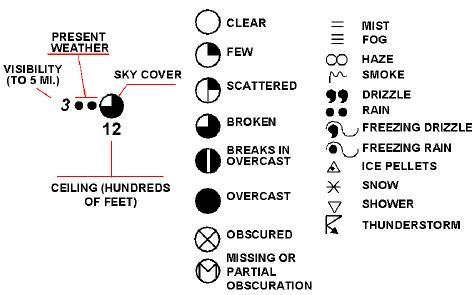
Visibility
The station model is labeled with the visibility when the station reports a visibility of five miles or less.
Current Weather
The present weather is shown by a symbol to the left of the station model.
Ceiling
If a ceiling exists, it is shown below the station model in hundreds of feet.
Automated or Manual Station
If a right bracket symbol is placed to the right of the station model, it indicates an automated weather reporting station.
MVFR and IFR Weather Conditions
The weather depiction chart shows areas of marginal and instrument weather conditions as outlines by a solid line. Marginal weather areas are outlined and not shaded, and instrument weather areas are outlined and shaded.