Hydrography
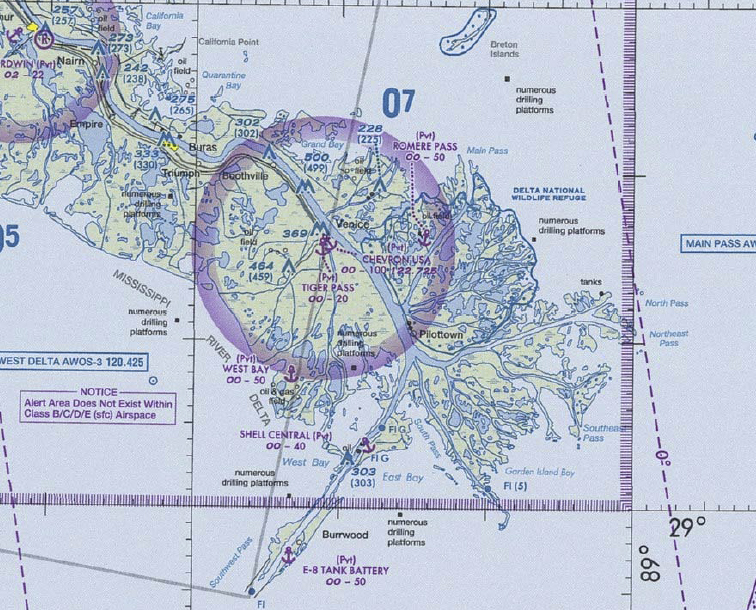
Two tones of blue are used to depict either areas of open water or inland water. The shores of open water areas, such as oceans, seas, bays, gulfs, etc., are drawn at their mean high water level. Water features such as lakes, streams, and rivers are drawn as inland water areas.
For example, the photo below shows a portion of the New Orleans sectional chart, which depicts the Mississippi river delta.
Terrain
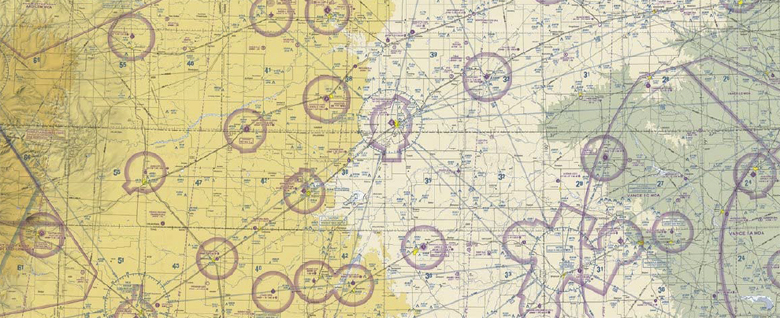
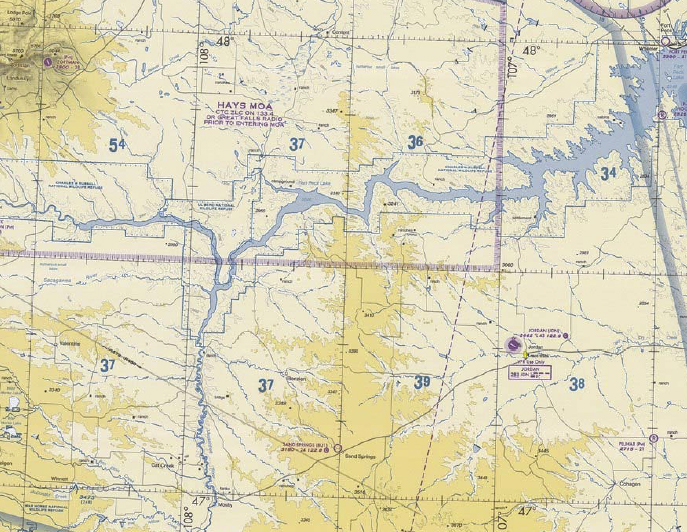
Bands of elevation are depicted by colored tinting of maps. The colors used range from light green, at elevations near sea level, to dark brown for the higher elevations. The image below illustrates how tinting is used to depict the gradually increasing elevations across western Kansas.
Shaded relief is used on visual navigation charts to depict an aerial view of terrain. The shading is added to depict how the terrain would appear if illuminated from the northwest. The image below shows the use of relief to aid in the depiction of terrain.
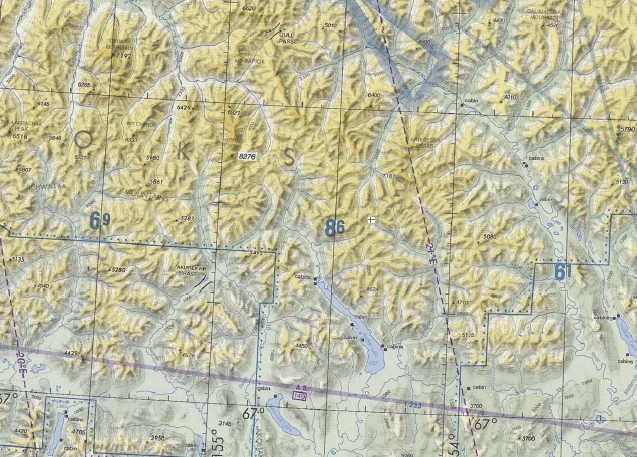
Contour lines, which are lines connecting points of equal elevation, are also drawn on visual charts to aid pilots in visualization of terrain. Basic contour lines are drawn at 500 foot intervals. Intermediate and auxiliary contour lines are added at 250, 150, 125, 100, or 50 foot intervals, as necessary to provide a depiction of terrain most beneficial to the pilot. Where the lines are spaced farther apart, gentler slopes exist. Closely spaced contours indicate steeper terrain features.
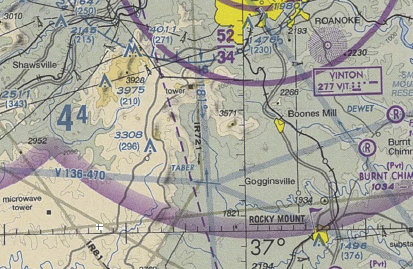
Lines of latitude and longitude are easy to see in the picture below. Lines of latitude run parallel to the equator, while lines of longitude run north south, converging at the north and south pole. Lines of longitude cross the equator at right angles and slowly converge as you move toward either pole. As a result, the distance between lines of longitude is not consistent as you change your latitude.
A maximum elevation figure is placed within each quadrant of a VFR navigation chart. The figure shows the highest altitude at which terrain or other vertical obstructions exist, rounded up to the next hundred feet. A quadrant is an area bounded by ticked lines dividing each 30 minutes of latitude and longitude on the chart. Because the maximum elevation figure is rounded to the nearest hundred feet, the last two digits are omitted.
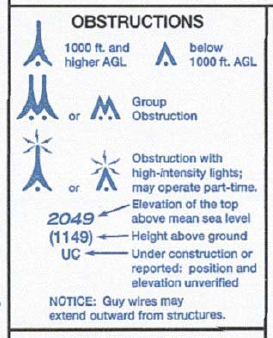
Obstructions
Any obstruction or vertical feature that could affect the national airspace system is charted. Generally, only structures taller than 200 feet are charted on a sectional chart. World aeronautical charts usually only depict structures taller than 500 feet. However, smaller structures are often charted that are considered hazardous, such as those near airports or much higher than the surrounding terrain.
Obstructions may be grouped to avoid chart congestion. MSL and AGL height is shown for each obstruction or group of obstructions. "UC" means the obstruction is under construction.