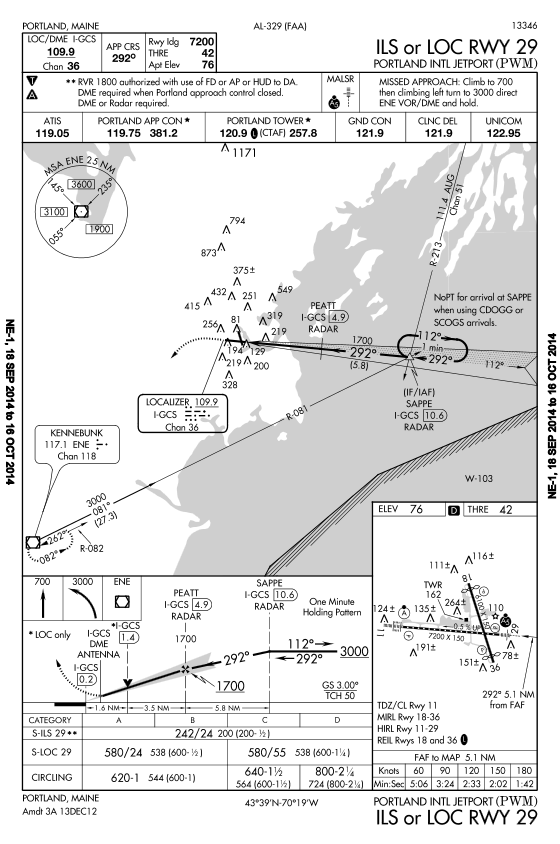
Profile View
The profile view is the next section on the chart. If shows a side view of the approach and depicts the vertical approach path, headings, distances, fixes, and altitudes. The profile view is not drawn to scale.
If an altitude is drawn with a line underneath, it indicates a minimum altitude. A maximum altitude is shown as an altitude with a line drawn above. If a line is drawn above and below an altitude, it means that altitude is mandatory.
Landing Minimums
The landing minimums section lists the lowest visibility requirements for the approach. Minimums are listed for categories of aircraft based on 1.3 Vso at maximum certified gross weight. If this speed is 90 knots or less, the aircraft is considered category A. For Category B aircraft, this speed is greater than 90 knots and 120 knots or less. For Category C aircraft, it is greater than 120 knots and 140 knots or less. From greater than 140 knots to 165 knots or less, the aircraft is Category D. If this speed is greater than 165 knots, the aircraft is Category E.
The minimums you select should be based on the airspeed at which you will fly the approach, even if your aircraft falls into a lower category.
Minimums will be shown as the MSL altitude followed by the visibility minimums. The minimum altitude is also given as AGL below the MSL altitude. Visibility minimums may be listed in statute miles or in runway visual range, or RVR. RVR is measured in hundreds of feet using transmissometers located near the runway. RVR values represent horizontal visibility at points along the runway.
The figures listed in parenthesis are for military operations and do not apply to us.
Airport Diagram
The chart includes an airport diagram that depicts runway orientation, airport lighting, final approach bearings, airport beacon location, obstructions, and key elevations. Airport elevation is indicated in a separate box at the top left of the airport sketch. Touchdown zone elevation is indicated at the approach end of the procedure's runway. Touchdown zone elevation is the highest elevation within the runway's touchdown zone, which is the first 3,000 feet of a runway.
Where lighting aids are noted using a white letter on a black symbol, that lighting aid is pilot controlled.
At larger airports, a separate page is devoted to the airport diagram.
Time and Speed Table
A time and speed table is included on the chart when it is applicable to the approach procedure. This table provides distances and times required to travel from the final approach fix to the missed approach point for selected ground speeds.